

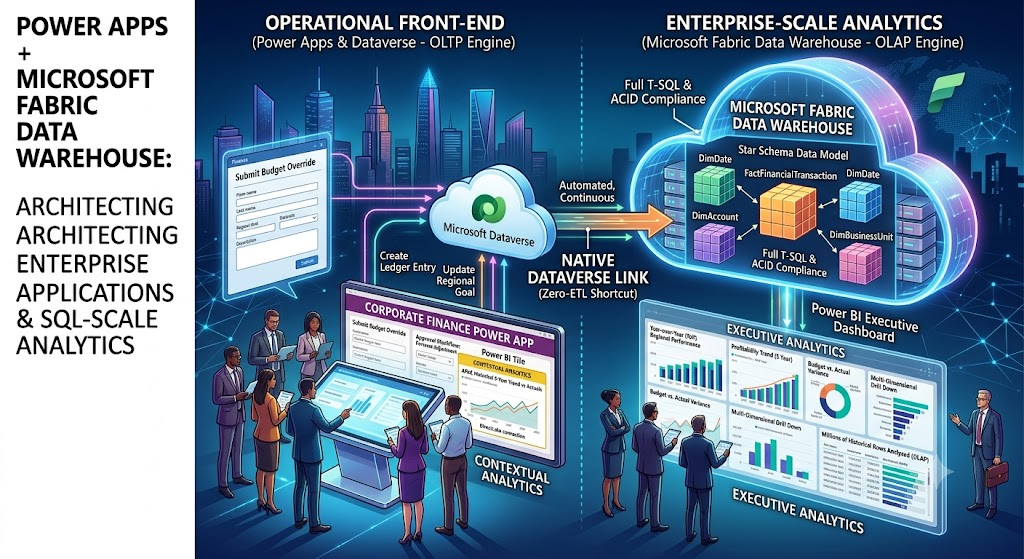
In complex enterprise environments, modern applications must handle two distinct operational burdens: executing rapid transactional updates and delivering aggregate historical analytics.
While Power Apps and Microsoft Dataverse provide the ideal front-end and $OLTP$ engine for business processes, reporting across millions of historical ledger records, multi-year trend comparisons, and financial dimensional models requires an $OLAP$ engine engineered for high-throughput SQL processing: Microsoft Fabric Data Warehouse.
This guide covers architectural patterns, dimensional modeling strategies, and performance rules for combining Power Apps with Fabric Data Warehouse.
Transactional Processing ($OLTP$) vs. Analytical Processing ($OLAP$)
To design scalable systems, developers must separate operational responsibilities from analytical processing:
                          ┌───────────────────────────┐
                          │   OPERATIONAL USER (App)  │
                          └─────────────┬─────────────┘
                                        │ (Writes Form Input / Claims)
                                        ▼
                          ┌───────────────────────────┐
                          │    Microsoft Dataverse    │  <-- OLTP Engine
                          └─────────────┬─────────────┘
                                        │
                         (Native Link / Shortcut Sync)
                                        │
                                        ▼
                          ┌───────────────────────────┐
                          │ Microsoft Fabric Warehouse│  <-- OLAP Engine
                          └─────────────┬─────────────┘
                                        │ (Executes Aggregations / Views)
                                        ▼
                          ┌───────────────────────────┐
                          │  EXECUTIVE DASHBOARD (BI) │
                          └───────────────────────────┘
| Dimension | Online Transaction Processing (OLTP) | Online Analytical Processing (OLAP) |
| Primary Platform | Microsoft Dataverse | Microsoft Fabric Data Warehouse |
| Operation Focus | High-frequency INSERT, UPDATE, DELETE | Complex SELECT, multi-table JOINs, heavy GROUP BYs |
| Data Structure | Highly normalized (3NF) relational tables | Star Schema / Snowflake Schema (Fact & Dimension tables) |
| Record Volume | Individual rows or targeted batches | Millions to billions of aggregated rows across time |
| Response Time | Milliseconds | Seconds (optimized over petabytes) |
Fabric Lakehouse vs. Fabric Data Warehouse
Both the Lakehouse and Data Warehouse engines exist within Microsoft Fabric, but they serve distinct operational patterns:
                            ┌────────────────────────┐
                            │   MICROSOFT FABRIC     │
                            └───────────┬────────────┘
                                        │
               ┌────────────────────────┴────────────────────────┐
               ▼                                                 ▼
    [ FABRIC LAKEHOUSE ]                               [ FABRIC DATA WAREHOUSE ]
 ─────────────────────────                          ───────────────────────────────
 • Primary Focus: Data Engineering                  • Primary Focus: Structured SQL Analytics
 • Format: Delta Tables / Unstructured Files        • Format: Native T-SQL Warehousing
 • Languages: PySpark, Scala, SQL                   • Languages: Full ACID T-SQL
 • Best For: Data Science, Raw Ingestion            • Best For: Financial Ledger, BI Models
- Choose Fabric Lakehouse when: You need Spark processing, machine learning models, or ingest unformatted/semi-structured files alongside structured data.
- Choose Fabric Data Warehouse when: Your primary workload involves structured T-SQL analytics, star-schema dimensional modeling, enterprise financial reporting, and traditional database warehouse teams.
Architecture Blueprint: Enterprise Financial Reporting System
Consider a global corporate finance system: 10 business units, 25 countries, and millions of transactional journal entries.
1. Operational Layer (Power Apps + Dataverse)
Finance managers interact with a Power Apps Canvas / Model-Driven Application to:
- Input quarterly budget adjustments.
- Submit forecast override requests.
- Execute multi-level approval workflows via Power Automate.
2. Synchronization Layer
Dataverse operational records synchronize automatically into Fabric OneLake via the Dataverse Link to Fabric, making transactional data instantly available without running manual export pipelines.
3. Analytical Layer (Fabric Warehouse)
The warehouse organizes financial data using a Star Schema to optimize query speed and aggregation performance.
                   ┌─────────────────────────┐
                   │       DimDate           │
                   └────────────┬────────────┘
                                │
   ┌──────────────────┐         │         ┌──────────────────┐
   │   DimCustomer    ├─────────┼─────────┤    DimProduct    │
   └──────────────────┘         │         └──────────────────┘
                                ▼
                   ┌─────────────────────────┐
                   │ FactFinancialTransaction│
                   └────────────┬────────────┘
                                │
                   ┌────────────┴────────────┐
                   │       DimRegion         │
                   └─────────────────────────┘
SQL Schema Definition
SQL
-- Dimension: RegionCREATE TABLE dbo.DimRegion ( RegionKey INT NOT NULL PRIMARY KEY NONCLUSTERED, RegionName VARCHAR(100) NOT NULL, Country VARCHAR(100) NOT NULL, BusinessUnit VARCHAR(100) NOT NULL);-- Fact: Financial TransactionsCREATE TABLE dbo.FactFinancialTransaction ( TransactionID BIGINT NOT NULL PRIMARY KEY NONCLUSTERED, DateKey INT NOT NULL, CustomerKey INT NOT NULL, ProductKey INT NOT NULL, RegionKey INT NOT NULL, AccountKey INT NOT NULL, Amount DECIMAL(18,2) NOT NULL, TransactionType VARCHAR(50) NOT NULL);
High-Speed Analytical Query Execution
SQL
-- Aggregating Year-over-Year Regional PerformanceSELECT d.FiscalYear, r.RegionName, r.BusinessUnit, SUM(f.Amount) AS TotalRevenueFROM dbo.FactFinancialTransaction fINNER JOIN dbo.DimDate d ON f.DateKey = d.DateKeyINNER JOIN dbo.DimRegion r ON f.RegionKey = r.RegionKeyWHERE f.TransactionType = 'Revenue'GROUP BY d.FiscalYear, r.RegionName, r.BusinessUnitORDER BY d.FiscalYear DESC, TotalRevenue DESC;
Closing the Loop: Embedding Contextual Analytics in Power Apps
Instead of switching between an operational application and a separate reporting portal, embed analytical context directly into the user interface.
┌────────────────────────────────────────────────────────────────────────┐│ FINANCIAL PLANNING POWER APP │├────────────────────────────────────────────────────────────────────────┤│ Forecast Input Form (Dataverse) ││ Region: [ APAC ▼ ] Target Forecast: [ $25,000,000 ] [ SUBMIT ] │├────────────────────────────────────────────────────────────────────────┤│ Contextual Enterprise Analytics (Embedded Fabric Power BI Tile) ││ ┌──────────────────────────────────────────────────────────────────┐ ││ │ 📊 APAC Historical 5-Year Trend vs Actuals (From Fabric DW) │ ││ │ ■ Revenue: $22.4M ■ Margin: 18.2% ■ Budget Variance: +2.1% │ ││ └──────────────────────────────────────────────────────────────────┘ │└────────────────────────────────────────────────────────────────────────┘
In-App Power Fx Calculations vs. Warehouse Aggregations
Keep lightweight validation logic inside Power Apps and offload complex calculations to Fabric:
Code snippet
// OK for in-app client calculation (Local record scope)UpdateContext({ locVariance: ThisItem.ActualAmount - ThisItem.BudgetAmount });// PREFER THIS: Offload multi-million row aggregation to Fabric; // filter pre-calculated aggregate views inside Power Apps.Filter(vw_Fabric_MonthlyAggregates, Region = DropdownRegion.Selected.Value)
Enterprise Security & Performance Optimization
1. Security Architecture
- Operational Boundary: Configure Dataverse Security Roles to control record-level access (
Create,Read,Write) within Power Apps. - Warehouse Boundary: Apply T-SQL Object-Level Security (
GRANT/DENYpermissions on schemas and views) in Fabric Data Warehouse. - Semantic Boundary: Apply Row-Level Security (RLS) in Power BI models using
USERPRINCIPALNAME()so regional managers only see their assigned territories.
2. Performance Engineering Rules
- Avoid Monolithic Queries in Power Apps: Never fetch raw, unaggregated transactional tables containing hundreds of thousands of rows directly into Power Apps collections.
- Delegate Filtering: Ensure all query operations on external SQL endpoints pass delegation boundaries so aggregations run on the server rather than the client device.
- Match Data Refresh to Business Need: Align refresh cadences with operational needs—use continuous shortcuts for near-real-time operational views, and scheduled batch refreshes for multi-year historical reports.
Certification Preparation Matrix
- PL-900 (Power Platform Fundamentals): Focuses on describing core Dataverse capabilities, recognizing when to use Power BI for enterprise reporting, and understanding cross-cloud Microsoft integrations.
- PL-100 (Power Platform App Maker): Emphasizes building relational data structures in Dataverse, executing delegable Power Fx functions, and embedding Power BI tiles inside Canvas screens.
- DP-600 (Microsoft Fabric Analytics Engineer): Covers architecting Fabric Data Warehouses, designing star schemas using T-SQL, optimizing DirectLake semantic models, and establishing enterprise data governance.
Key Takeaways
- Clear Workload Separation: Use Dataverse for transactional app updates ($OLTP$) and Fabric Data Warehouse for heavy relational analytics ($OLAP$).
- Native Virtualization: Connect Dataverse to Fabric using native links to eliminate manual, fragile ETL pipelines.
- Star Schema Design: Model warehouse structures with Fact and Dimension tables to ensure sub-second analytical performance.
- Contextual User Experiences: Embed Fabric analytics directly inside Power Apps to provide real-time operational context.
What’s Next?
In Article 6: Power Apps and Power BI Integration Using Microsoft Fabric, we will explore:
- Passing dynamic context bidirectionally between Power Apps and Power BI reports.
- Deep-diving into Fabric Semantic Models and DirectLake mode.
- Building an interactive, embedded Executive Sales Dashboard inside a Canvas application.
Discover more from Common Man Tips for Power Platform, Dynamics CRM,Azure
Subscribe to get the latest posts sent to your email.

